Setting aside (for the moment) the legal and technical analysis (and motives) of the maps created by the Special Master, we members of the public have not been graced with an easily accessible version of the maps for perusal.
The Special Master felt that none of the submissions were worthy of his approval so he drew two maps of his own. Â These maps only affect the 3rd Congressional district and the surrounding, 1st, 2nd, 4th and 7th Congressional Districts. Â Although the submissions of the Special Master are available on the Division of Legislative Services redistricting website, easily viewable maps (without specialized software) are not available…until now:
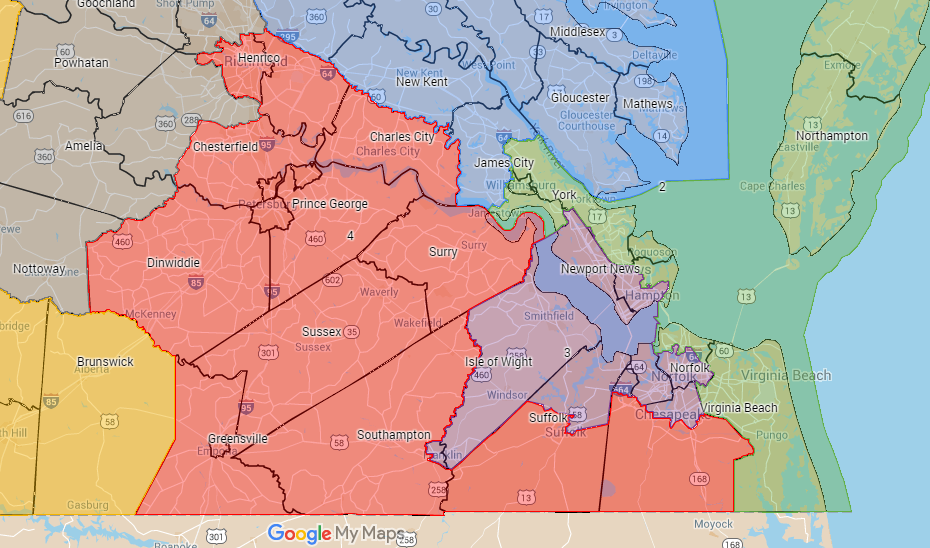
The Special Master created his own plan:
The Special Master also created a modified version of the NAACP plan:
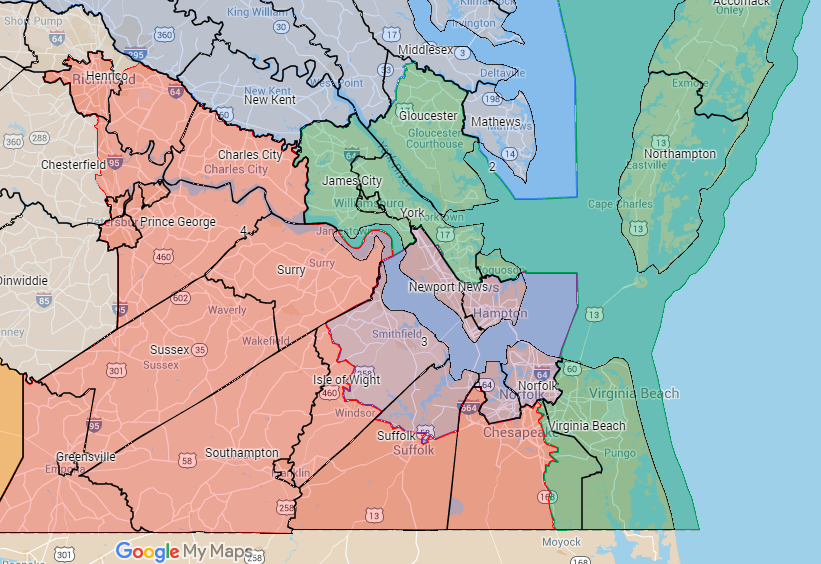
These plans can be viewed in an interactive fashion where you can scroll around the Commonwealth with County and City borders
The Virginia Congressional Republicans have moved to stay this process given the news on Friday that the Supreme Court will take up the case. Â The three Judge panel has chosen not to hear the motion on an expedited basis and the parties will still be required to file briefs in support or opposition of the Special Master’s plans over the next two weeks.
UPDATE: Â VPAP now has some great maps with demographics attached.
2 comments
Some points about the alternate proposal:
-The Second District becomes over 52.5% McCain. Considering Rigell has held this district as-is (Obama won it in 2008), the 2nd becomes Safe Republican. I doubt Democrats will try to ever make a serious bid for it until at least 2022 when a new map goes up for redistricting.
-Randy Forbes is even more screwed under this alternate proposal. We’re looking at 62% Obama from 2008. He would hold the most Democratic leaning seat in America for sure if he somehow won an election under this map (and I’m willing to bet pretty much anything that won’t happen).
-The 3rd District remains safe Democrat still, just like in the first proposal.
-Hit the panic button for the 7th District. This map puts Dave Brat in jeopardy. His district drops down from being 53% McCain to just over 51% McCain. And Brat’s voting record means he would be an easy target for either the Eric Cantor wing of the party to primary, or the Democrats to try to pull off an upset. His district suddenly starts to look more like Barbara Comstock’s. Brat may survive with this map, but he’ll have to constantly watch his back every two years. (Keep in mind, Hanover County essentially delivered the district to Brat back in the summer of 2014. Both of these proposals move Hanover into the 1st District)
Just ran the numbers for this proposal…and I can definitely say that Forbes would be gone under this map. He may as well just retire rather than lose by at least 10 points next year.
2000-2009 average for the District is 56% Dem, 44% Republican. Obama won the District in 2008 with roughly 60% of the vote.
In short, if Randy Forbes somehow won an election in this District, he would be holding the most Democratic seat in America as a Republican (or perhaps the second most Democratic…Illinois’ 10th may edge this seat out as it’s D+8 and a Republican currently holds the seat).