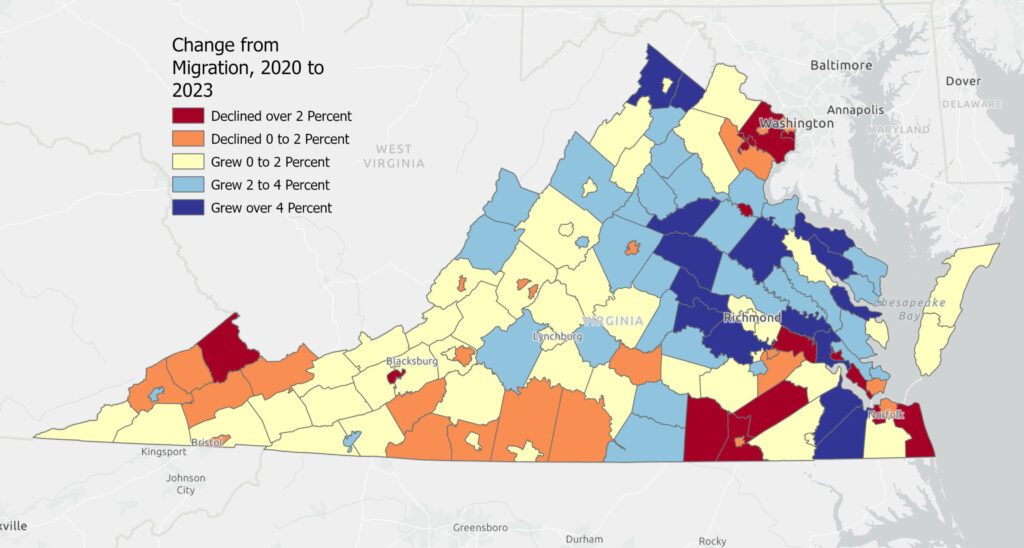
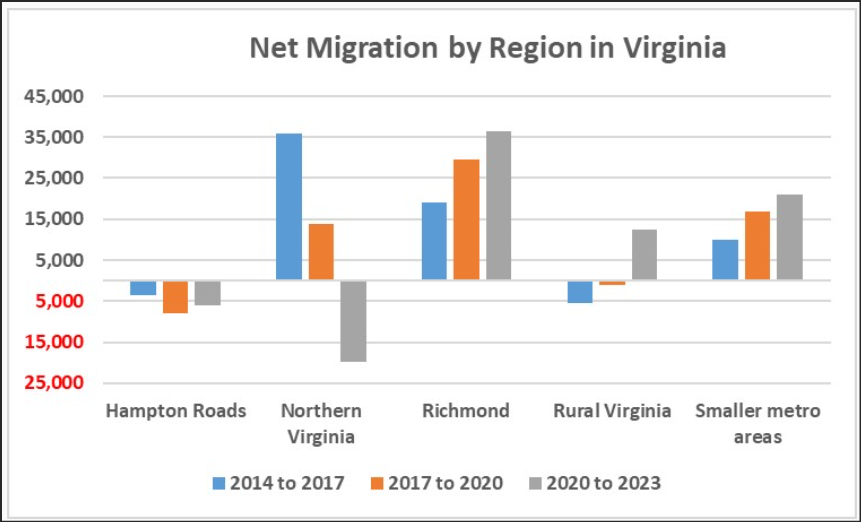
Population growth patterns are shifting within Virginia. So far during the current decade, Virginia’s two largest metropolitan areas — Northern Virginia and Hampton Roads — have been losing population due to net migration (more people moving out than moving in). The trend, evident before the Covid epidemic, became more pronounced during and after.
Meanwhile, Richmond has emerged as the state’s new in- migration growth leader. And in an encouraging turnabout, Virginia’s smaller metros (collectively) and rural localities (collectively) have been gaining population through in-migration as well, according to analysis by Hamilton Lombard at the Demographics Research Group of the University of Virginia.
The fastest growth is occurring in a string of non-urban counties stretching from Stafford in the north to Chesterfield in the south (shown in dark blue).

“The same pattern of out-migration seen in Northern Virginia is occurring in most of the country’s largest metropolitan areas, indicating that a wider demographic shift is taking place,” writes Lombard. “The rise of remote work has helped fuel this shift, as it offers people the flexibility to move to areas with better living standards and a lower cost of living.”
“The explosion in remote work during the pandemic and its persistence since then,” he continues, “is shaping up to be the most impactful demographic trend since expansion of suburbs and exurbs after World War II.”
It is important to note, however, that Virginia’s overall population growth (which reflects births and deaths as well as in/out migration) lagged the national numbers between 2010 and 2023 and was trounced by growth in the South Atlantic states. Richmond and the smaller metros cannot compare to Northern Virginia as an economic growth engine.
As Virginia’s public policy lurches ever more forcefully to the left (see Steve Haner’s post preceding this one), the Old Dominion looks to be a perennial weak sister among the dynamic South Atlantic states.
Read Lombard’s analysis for the details.
Article from baconsrebellion.com


3 comments
NYC farmers buying farms.
I don’t know where this data came from but in the case of my rural county it is 100% wrong.
Between 2010 and 2020 my rural county LOST 5%. The out migration continues – since 2020 my county has lost another 2.5%, yet the map has my county in the gained 2-3% color.
Ditto for my rural Shenandoah Valley county. Map shows Growth 0-2%. Census data from 2000, 2010, and 2020 shows constant 4-6% per decade LOSS.